The secret to building a successful flywheel
Knowing how to measure and optimize each stage.
This post is going to teach you about the power of measuring each stage of the product-led growth flywheel.
Understanding the different metrics and emotions associated with each stage is the secret that will help you grow and sustain your SaaS product.
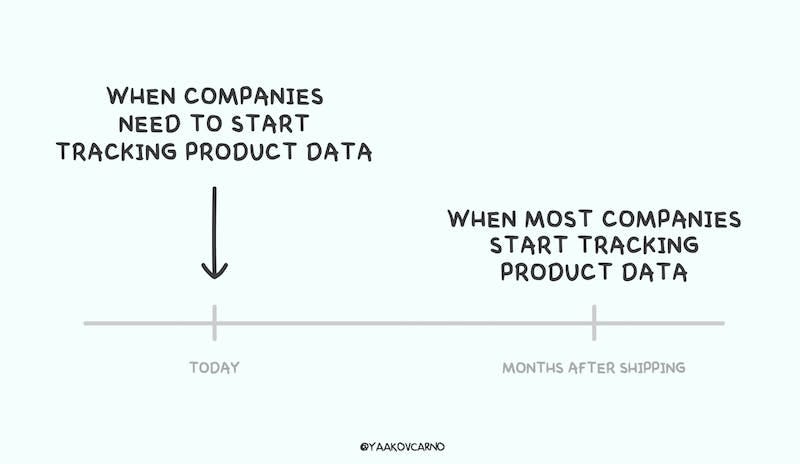
Unfortunately, most people fail to recognize the importance of measuring these stages, leading to a lack of insights, missed opportunities for growth, and poor team motivation.
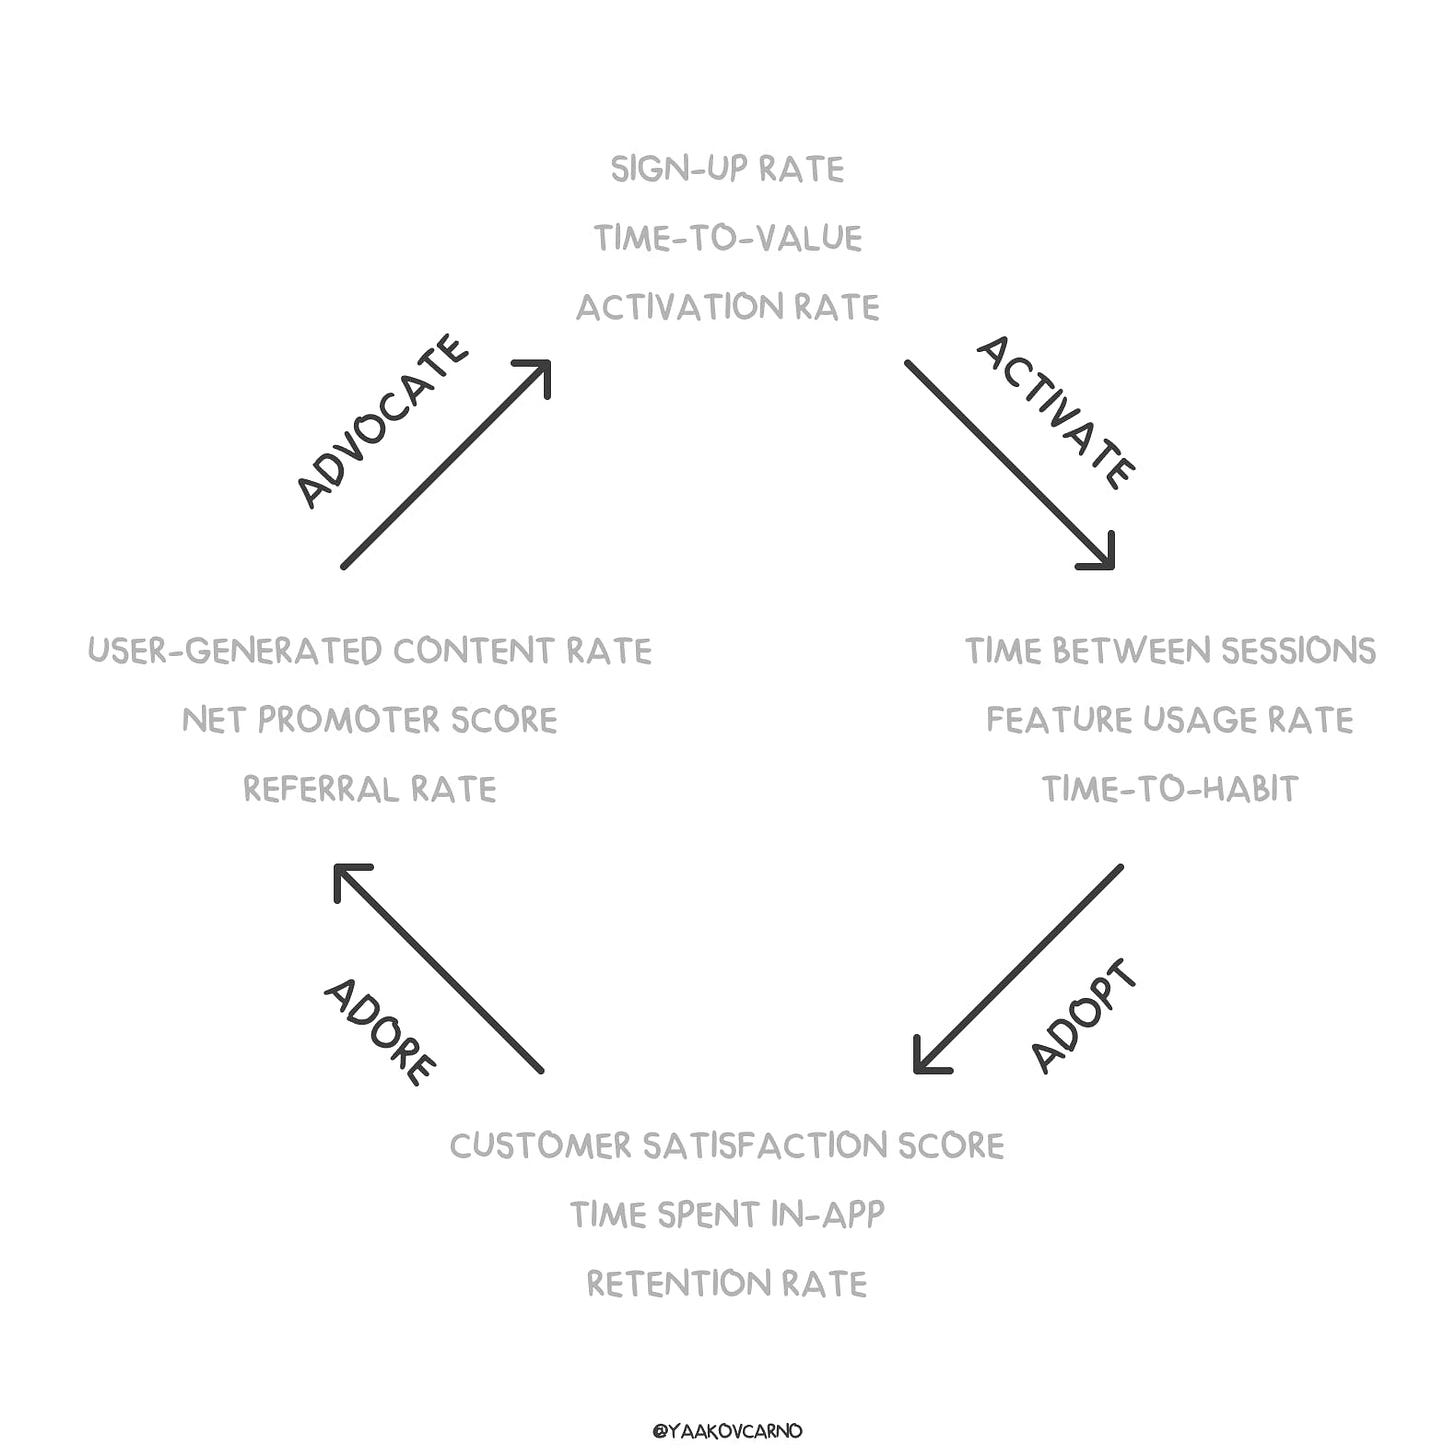
Each stage has its own set of metrics and emotions, which when measured and analyzed, can provide valuable insights into how to improve your product’s performance, increase customer loyalty, and drive growth.
For each stage I'm going to discuss 3 metrics that you should start measuring today. Let's dive in!
Activate
During the activation stage, users are just getting started with your product, and you need to make sure that users are completing the activation process as quickly and as easily as possible.
Sign-up rate
This measures the number of people who create an account on your platform or website.
Why? It helps you understand the effectiveness of your marketing efforts and how appealing your product is to potential users.
How? Divide the number of sign-ups by the total number of website visits.
Activation rate
This measures the percentage of users who reach an activation milestone.
Why? It shows how successful your onboarding process is in converting sign-ups into activated users.
How? Divide the number users that reached the activation milestone by the total number of sign-ups.
Time-To-Value
This measures the time it takes for a user to first experience value in your product.
Why? It helps you identify any roadblocks or barriers in the onboarding process that might be preventing users from ever experiencing your product’s potential.
How? Record the time (actual length/number of steps) between sign-up and the first time the user reaches a significant activation milestone.
The lower your product’s TTV is, the higher the chances are for users to activate and ultimately converting into paying users.
Adopt
In the Adopt stage, users are using your product regularly and want to see that it is helping them achieve their goals.
You need to make sure that users are building habits within your product and that it is delivering the results they need. When users feel that they’ve made the right choice in using your product they will adopt it into their daily workflows.
Time to Habit
This measures the time it takes for a user to start building habits in your product.
Why? It helps you understand the effectiveness of your product in encouraging users to form habits. The faster a user forms a habit, the more likely they are to become a loyal customer and continue using your product over time.
How? Identify which actions signal that a user has started forming a habit in your product and then record the time it takes for users to reach those milestones.
Time between sessions
This measures how much time elapses between each user session.
Why it’s important: It helps you understand how frequently users need to use your product to achieve their goals and identify areas where improvements can be made to increase engagement.
How? Track the time between sessions per user.
A similar metric here is WAU/MAU which measures the number of unique users who engage with your product within a specific time period.
A high WAU/MAU rate indicates that users are engaged with your product on a regular basis, which is a positive sign for product growth and user retention. Conversely, a low WAU/MAU rate may indicate that users are not finding your product useful enough to engage with it regularly, which could result in lower user retention rates over time.
Feature usage rate
This measures the percentage of users who use specific features of your product.
Why? It helps you understand which features are most popular and which ones need improvement or promotion in order to boost overall product adoption.
Practical tip: Track feature usage rates by monitoring user behavior in your product analytics and through surveys.
Adore
During the Adore stage, users have formed an emotional connection with your product and want to continue using it.
Users should enjoy their experience with your product and feel positively about it. Here you want to measure how satisfied and fulfilled users feel by their use of your product.
Customer satisfaction score (CSAT)
This measures how satisfied users are with your product overall.
Why? It helps you understand how well your product is meeting the needs of users and identify areas where improvements can be made to increase satisfaction and loyalty.
How? Send CSAT surveys to your users and use the responses to calculate your score: Number of satisfied user/Total = CSAT
Check out this article for a full deep dive into CSAT - https://survicate.com/customer-satisfaction/what-is-csat/
Time spent in-app
This measures how much time users spend in your product overall.
Why? It helps you understand how engaged users are with your product and how much value they’re getting from it. If users are spending lots of time in your product, they’re probably getting a lot of value from it. And if they’re getting a lot of value from your product, it’s a strong indicator that they really like it.
How? Track total sessions and length per user. While you’re at it you can also discover insights from metrics such as average session time per user.
Retention rate
This measures the percentage of users who continue to use your product over time.
Why? It helps you understand how well your product is meeting the needs of users and if you’re successfully building long-term relationships with users.
How? Divide your active users that remain active at the end of a given period by the total number of active users you had at the beginning of that time period.
There are many different ways to measure retention and also many mistakes that people make. Here is a great article to learn more about formula’s to calculate retention rate + top 4 mistakes to avoid - https://www.paddle.com/resources/calculate-retention-rate
Advocate
This is when users are actively promoting your product to others and want to know that they can trust you.
In this stage you want users to feel confident that they can recommend your product to others without hesitation. It’s not always as easy to quantify but you’re measuring the sense of commitment to your product and brand.
Net promoter score (NPS)
This measures how likely users are to recommend your product to others. Why? It helps you understand how satisfied users are with your product and how likely they are to become advocates. How? Send NPS surveys to your users and use the responses to calculate your NPS score - % of promoters – % of detractors = NPS
Check out this article for a full deep dive into NPS - https://survicate.com/blog/how-to-calculate-nps/
Referral rate
This measures the percentage of users who refer others to your product. Why? It helps you understand how likely users are to become advocates and share your product. How? Create a referral program for your product and measure how many users participate.
You should also measure referral sources - where referred users are coming from, such as social media, email, or word-of-mouth. And referral value - the total amount of revenue generated from referred users.
This will help you understand the financial impact of your referral program and which channels are most effective.
User-generated content rate
This measures the percentage of users who create content related to your product, such as blog posts, videos, or social media posts.
Why? It helps you understand how engaged users are with your product and how likely they are to attract more potential users through showcasing your product.
How? Track user-generated content by monitoring social media and other online channels for mentions of your product.
Conclusion
By taking the time to measure and optimize each aspect of the flywheel, you can avoid so many common pitfalls and unlock the full potential of PLG.
So, remember to focus on each stage of the process and optimize your efforts for maximum results.
Because without clearly defined metrics and goals, even the most impressive growth can be nothing more than a fleeting illusion, leaving your team without the direction and insight needed to achieve meaningful impact.


